The Best Deployment Solution for MQTT Broker Performance Monitoring - EMQX (2)
Docker compose deploys complete monitoring system components with one click

Preface
After successfully establishing EMQX as the brain of MQTT, it is difficult to estimate whether the server can withstand the corresponding resource consumption. By monitoring changes in performance, a chart can provide timely feedback on the current situation. I believe it will allow us to further cope with the risks that will be expected in the future.
But this alone is not as powerful as the title describes. We need an installation method that is different from the past installation method of installing components one by one and then concatenating data. ~~~Let yourself get off work earlier😂~~~
And this will bring up today’s protagonist Docker compose!!, which is more advanced than Docker, but can deploy multiple Dockers at one time to start all components with one click.
before the start
Before officially entering our topic today, the tools you will need to prepare are as follows:
- Virtual Machine (Centos, Ubuntu) *Docker
- Docker Compose *git
- For Docker installation, you can refer to official link to choose the appropriate operating system.
- git installation
1sudo apt install git #Ubuntu1sudo yum install git #Centos
Preliminary steps
Grab this file through Git and enter the folder
1
2
git clone https://github.com/as183789043/EMQX-Single_Node_Monitor.git cd EMQX-Single_Node_MonitorAdd a new file and modify the permissions (Theoretically, Docker compsoe can be created by yourself, but the author will have permission problems when implementing it, so it is created manually)
1
2
mkdir emqx1_data chmod 777 emqx1_data2024/03/03Update Exclude manual permission modification operationsBy adding a busybox container in the file docker-compose.yaml, instead of manually setting permissions in the past Then change the startup sequence of the original emqx container to wait for the completion of the busybox task.Start the file
1docker compose up -d
At this point, all monitoring components have been successfully started, and we enter the next stage.
File content description
What exactly is done with the pulled files and the detailed explanation of the program code will be explained in this chapter.
docker-compose.yaml
1 2 3 4 5 6 7 8 9 10 11 12 13 14 15 16 17 18 19 20 21 22 23 24 25 26 27 28 29 30 31 32 33 34 35 36 37 38 39 40 41 42 43 44 45 46 47 48 49 50 51 52 53 54 55 56 57 58 59 60 61 62 63 64 65 66 67 68 69 70 71 72 73version: '3' services: busybox: image: busybox:latest container_name: bustybox volumes: - ./emqx1_data/:/root/emqx1_data/ command: [ "chown", "-R","1000:1000" ,"root/emqx1_data"] networks: - emqx-bridge emqx1: image: emqx:5.3.2 container_name: emqx1 healthcheck: test: ["CMD", "/opt/emqx/bin/emqx ctl", "status"] interval: 30s timeout: 60s retries: 5 ports: - 1883:1883 - 8083:8083 - 8084:8084 - 8883:8883 - 18083:18083 volumes: - ./emqx1_data/:/opt/emqx/data networks: emqx-bridge: aliases: - node1.emqx.io depends_on: 'busybox': condition: service_completed_successfully prometheus: image: prom/prometheus container_name: prometheus volumes: - ./prometheus.yaml:/etc/prometheus/prometheus.yaml command: --config.file=/etc/prometheus/prometheus.yaml ports: - 9090:9090 networks: - emqx-bridge pushgateway: image: prom/pushgateway container_name: pushgateway ports: - 9091:9091 networks: - emqx-bridge node-exporter: image: prom/node-exporter container_name: node-exporter ports: - 9100:9100 networks: - emqx-bridge grafana: image: grafana/grafana-oss container_name: grafana ports: - 3000:3000 networks: - emqx-bridge networks: emqx-bridge: driver: bridgedocker-compose.yaml 说明version: '3' is the current fixed version of docker compose and can be adjusted according to the official website release services: service name of each component (emqx1, prometheus) container_name: The container identification name on the virtual machine ports: The former is an external connection port and the latter is an internal port volumes: The location where external files are mounted to the container networks: The network card used, only the same container can communicate with each other command: Specify the startup command of the container depends_on: Specify after whom the container should be started to ensure dependencies depends_on > condition: further restrict the previous container to complete specific conditions before starting the current container. networks > emqx-bridge > driver: Define the network card name emqx-bridge to use bridge modeprometheus.yaml -> Generated through EMQX web page. Targets can directly write
on the same network interface card 1 2 3 4 5 6 7 8 9 10 11 12 13 14 15 16 17 18 19 20 21 22 23 24 25 26 27 28 29 30 31global: scrape_interval: 15s # The default scrape interval is every 10 seconds. evaluation_interval: 15s # The default evaluation interval is every 10 seconds. # On this machine, every time series will be exported by default. external_labels: monitor: 'emqx-monitor' # Load rules once and periodically evaluate them according to the global 'evaluation_interval'. rule_files: # - "first.rules" # - "second.rules" - "/etc/prometheus/rules/*.rules" # Data pull configuration scrape_configs: - job_name: 'node-exporter' scrape_interval: 5s static_configs: # node-exporter IP address and port - targets: ['node-exporter:9100'] labels: instance: dashboard-local #EMQXPushgateway monitoring - job_name: 'pushgateway' scrape_interval: 5s honor_labels: true static_configs: # Pushgateway IP address and port - targets: ['pushgateway:9091']dashboard.json -> as a template configuration file for Garfana dashboard
Data connection settings
Important component connection information You need to change your password when logging in for the first time
| Service | Port | Username | Password |
|---|---|---|---|
| Grafana | 3000 | admin | public |
| EMQX | 18083 | admin | admin |
EMQX push information settings
Note!!Pushgateay needs to enter 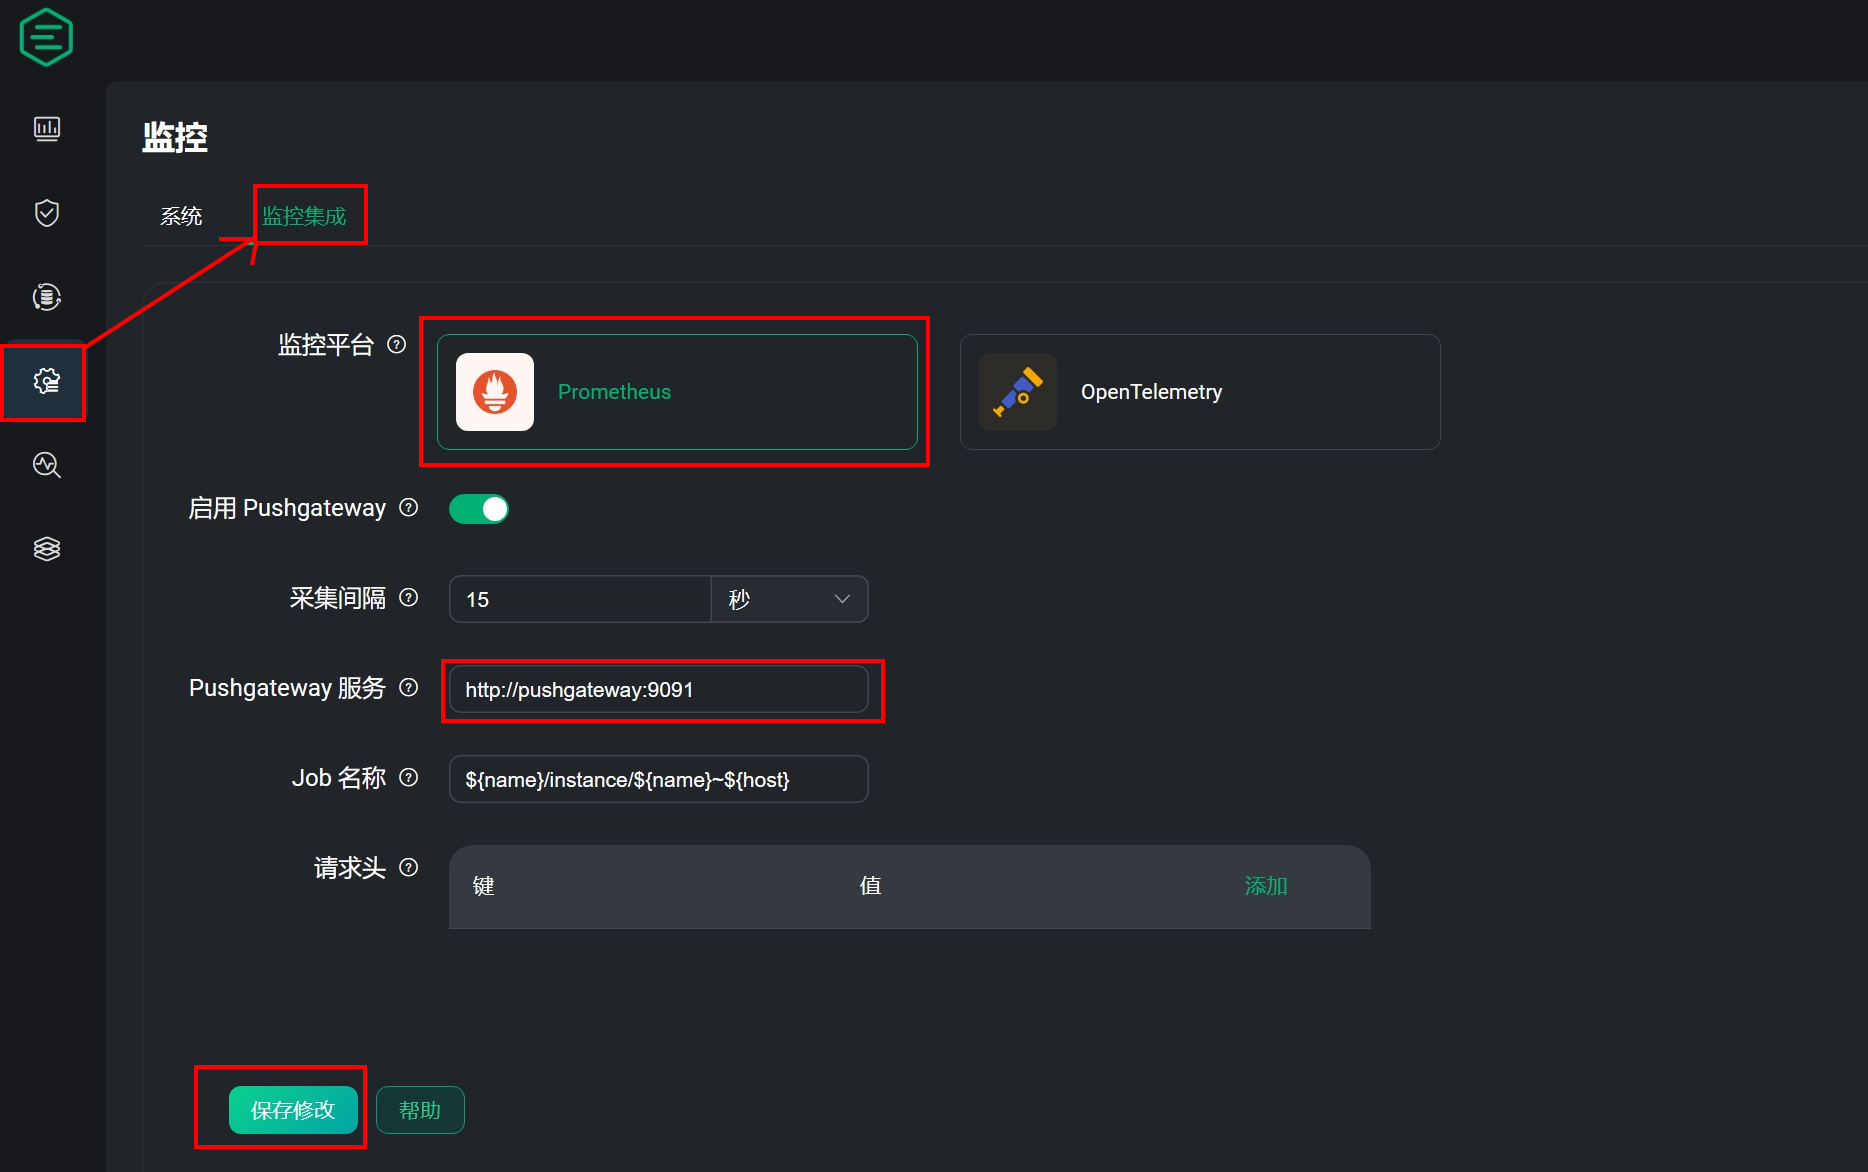
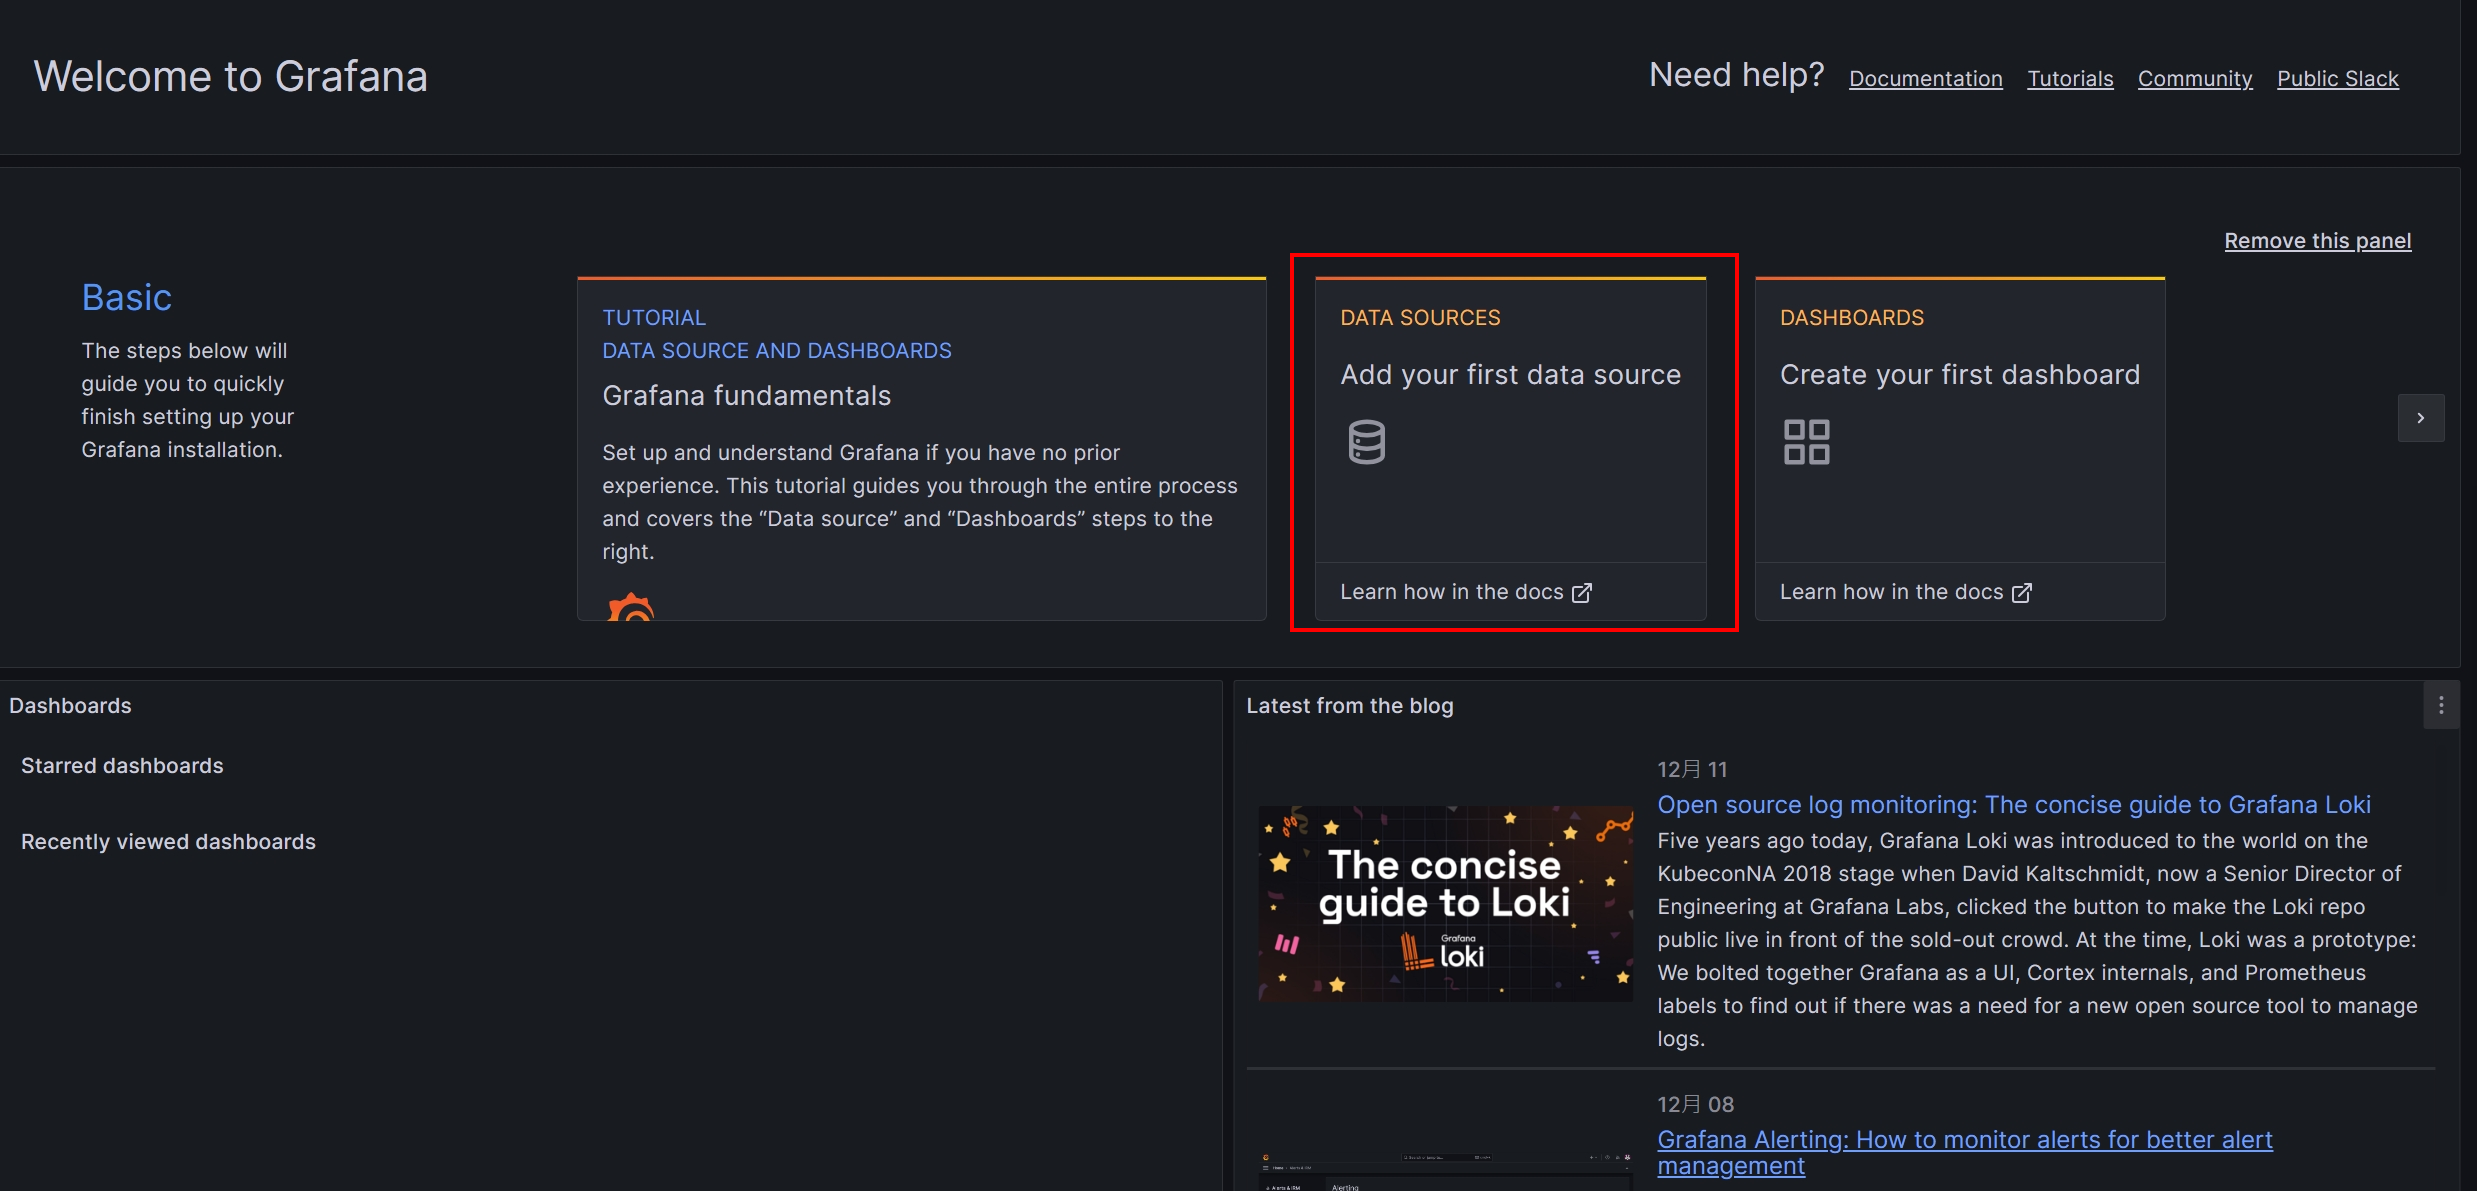
Grafana setting data source
The previous step pushed EMQX data to Prometheus. Then in Grafana, Prometheus must be set as the source accordingly.
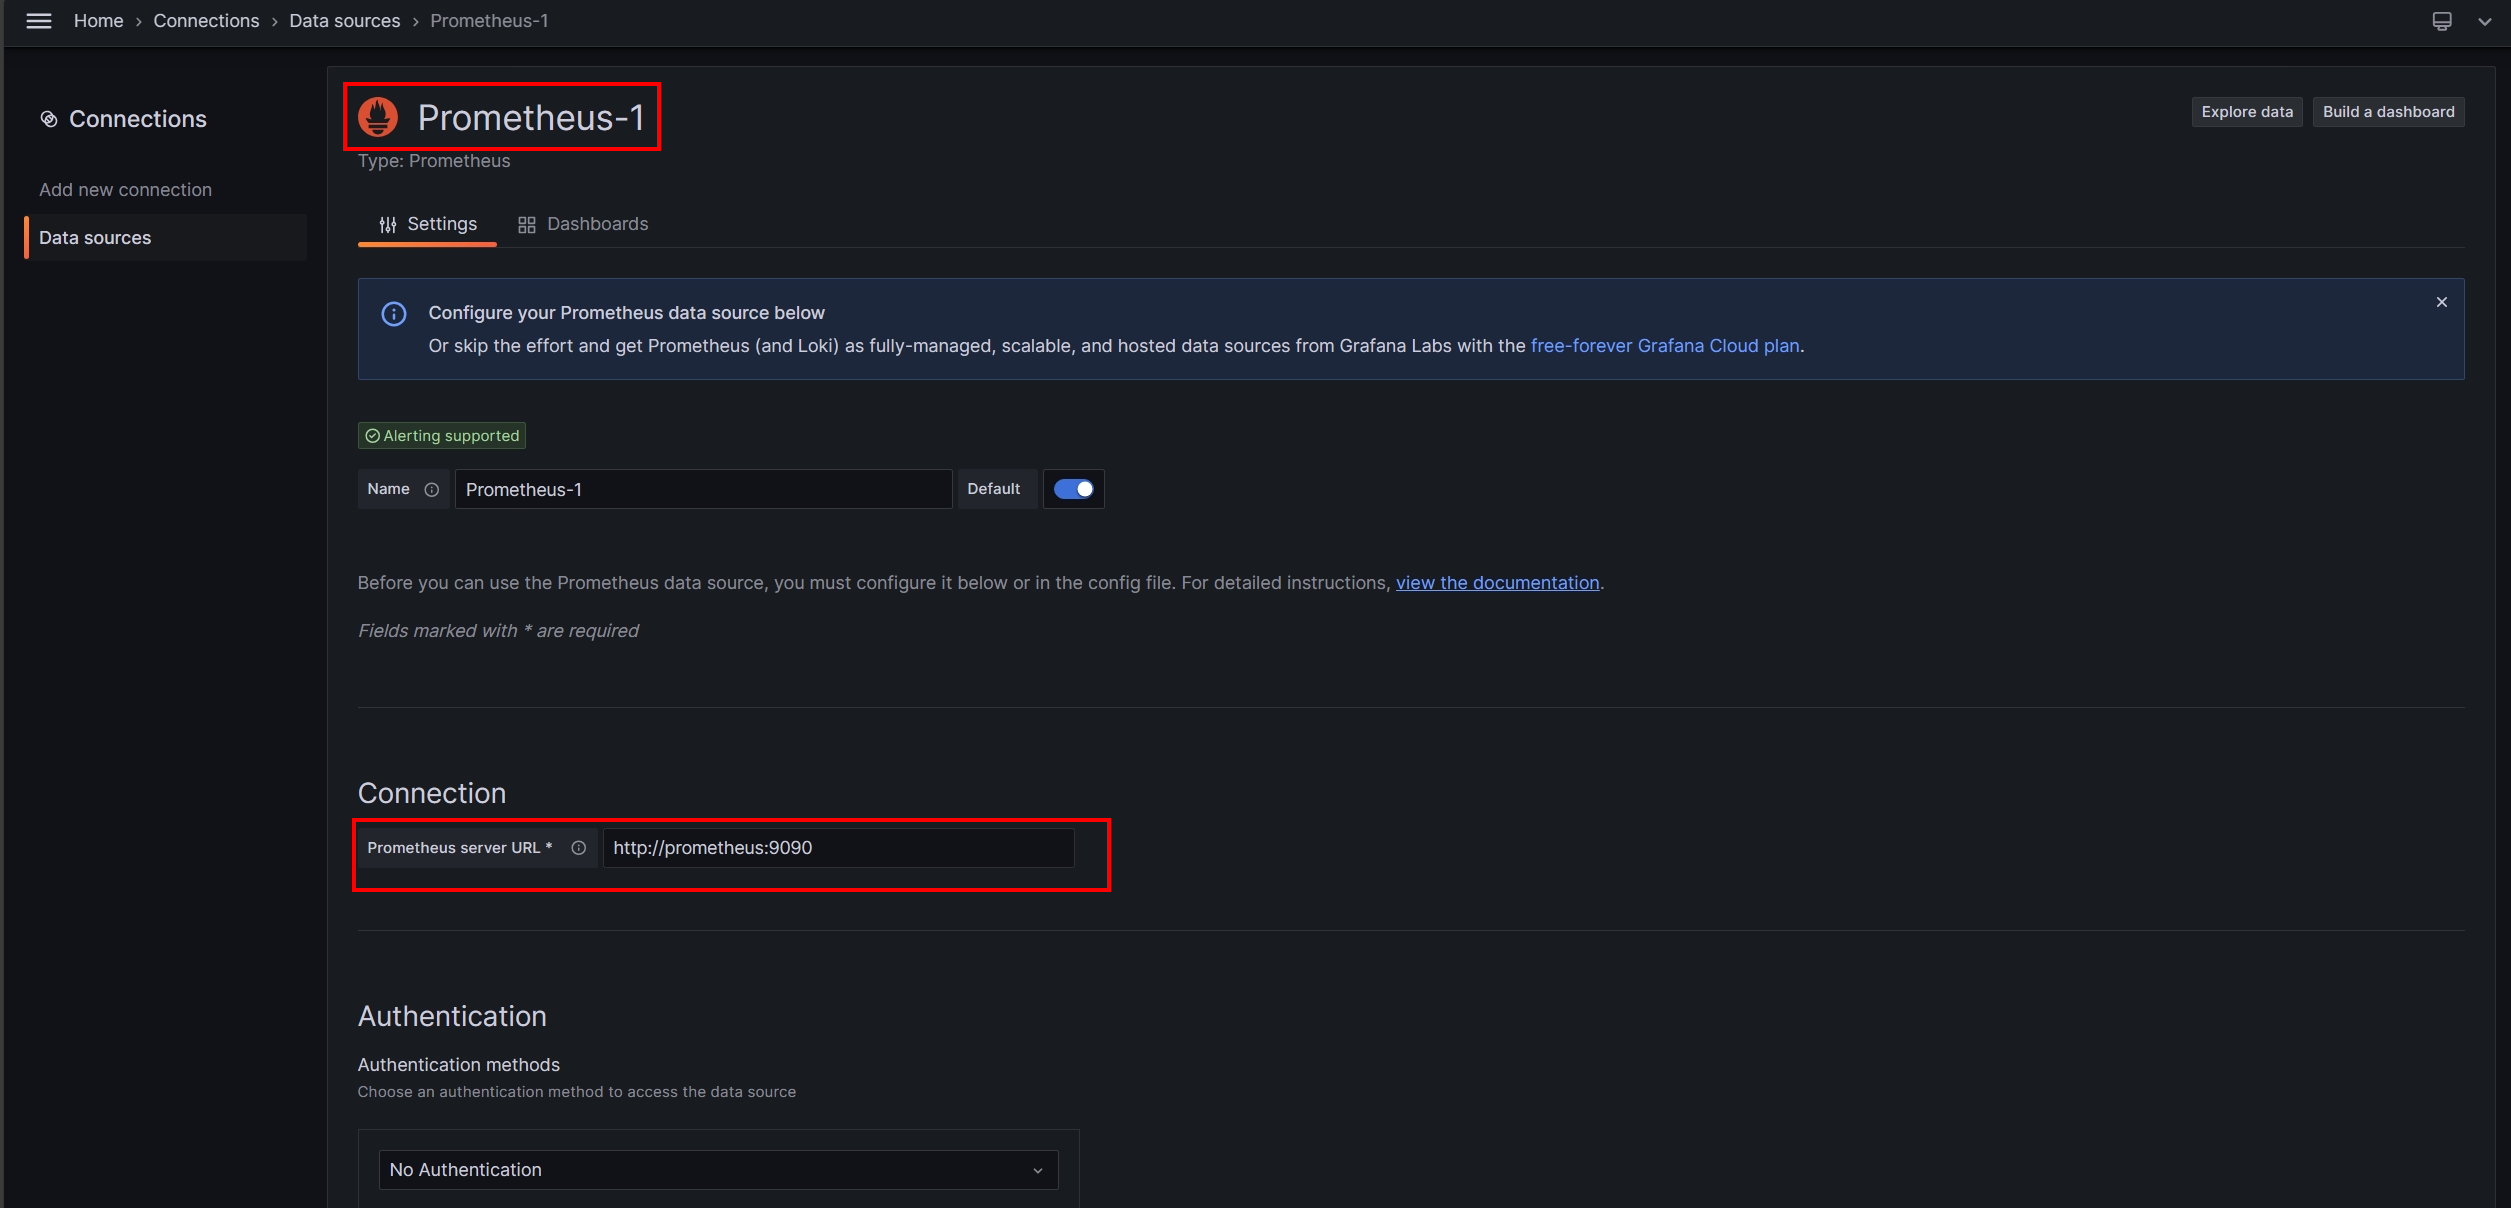
After selecting Prometheus, enter the input connection location
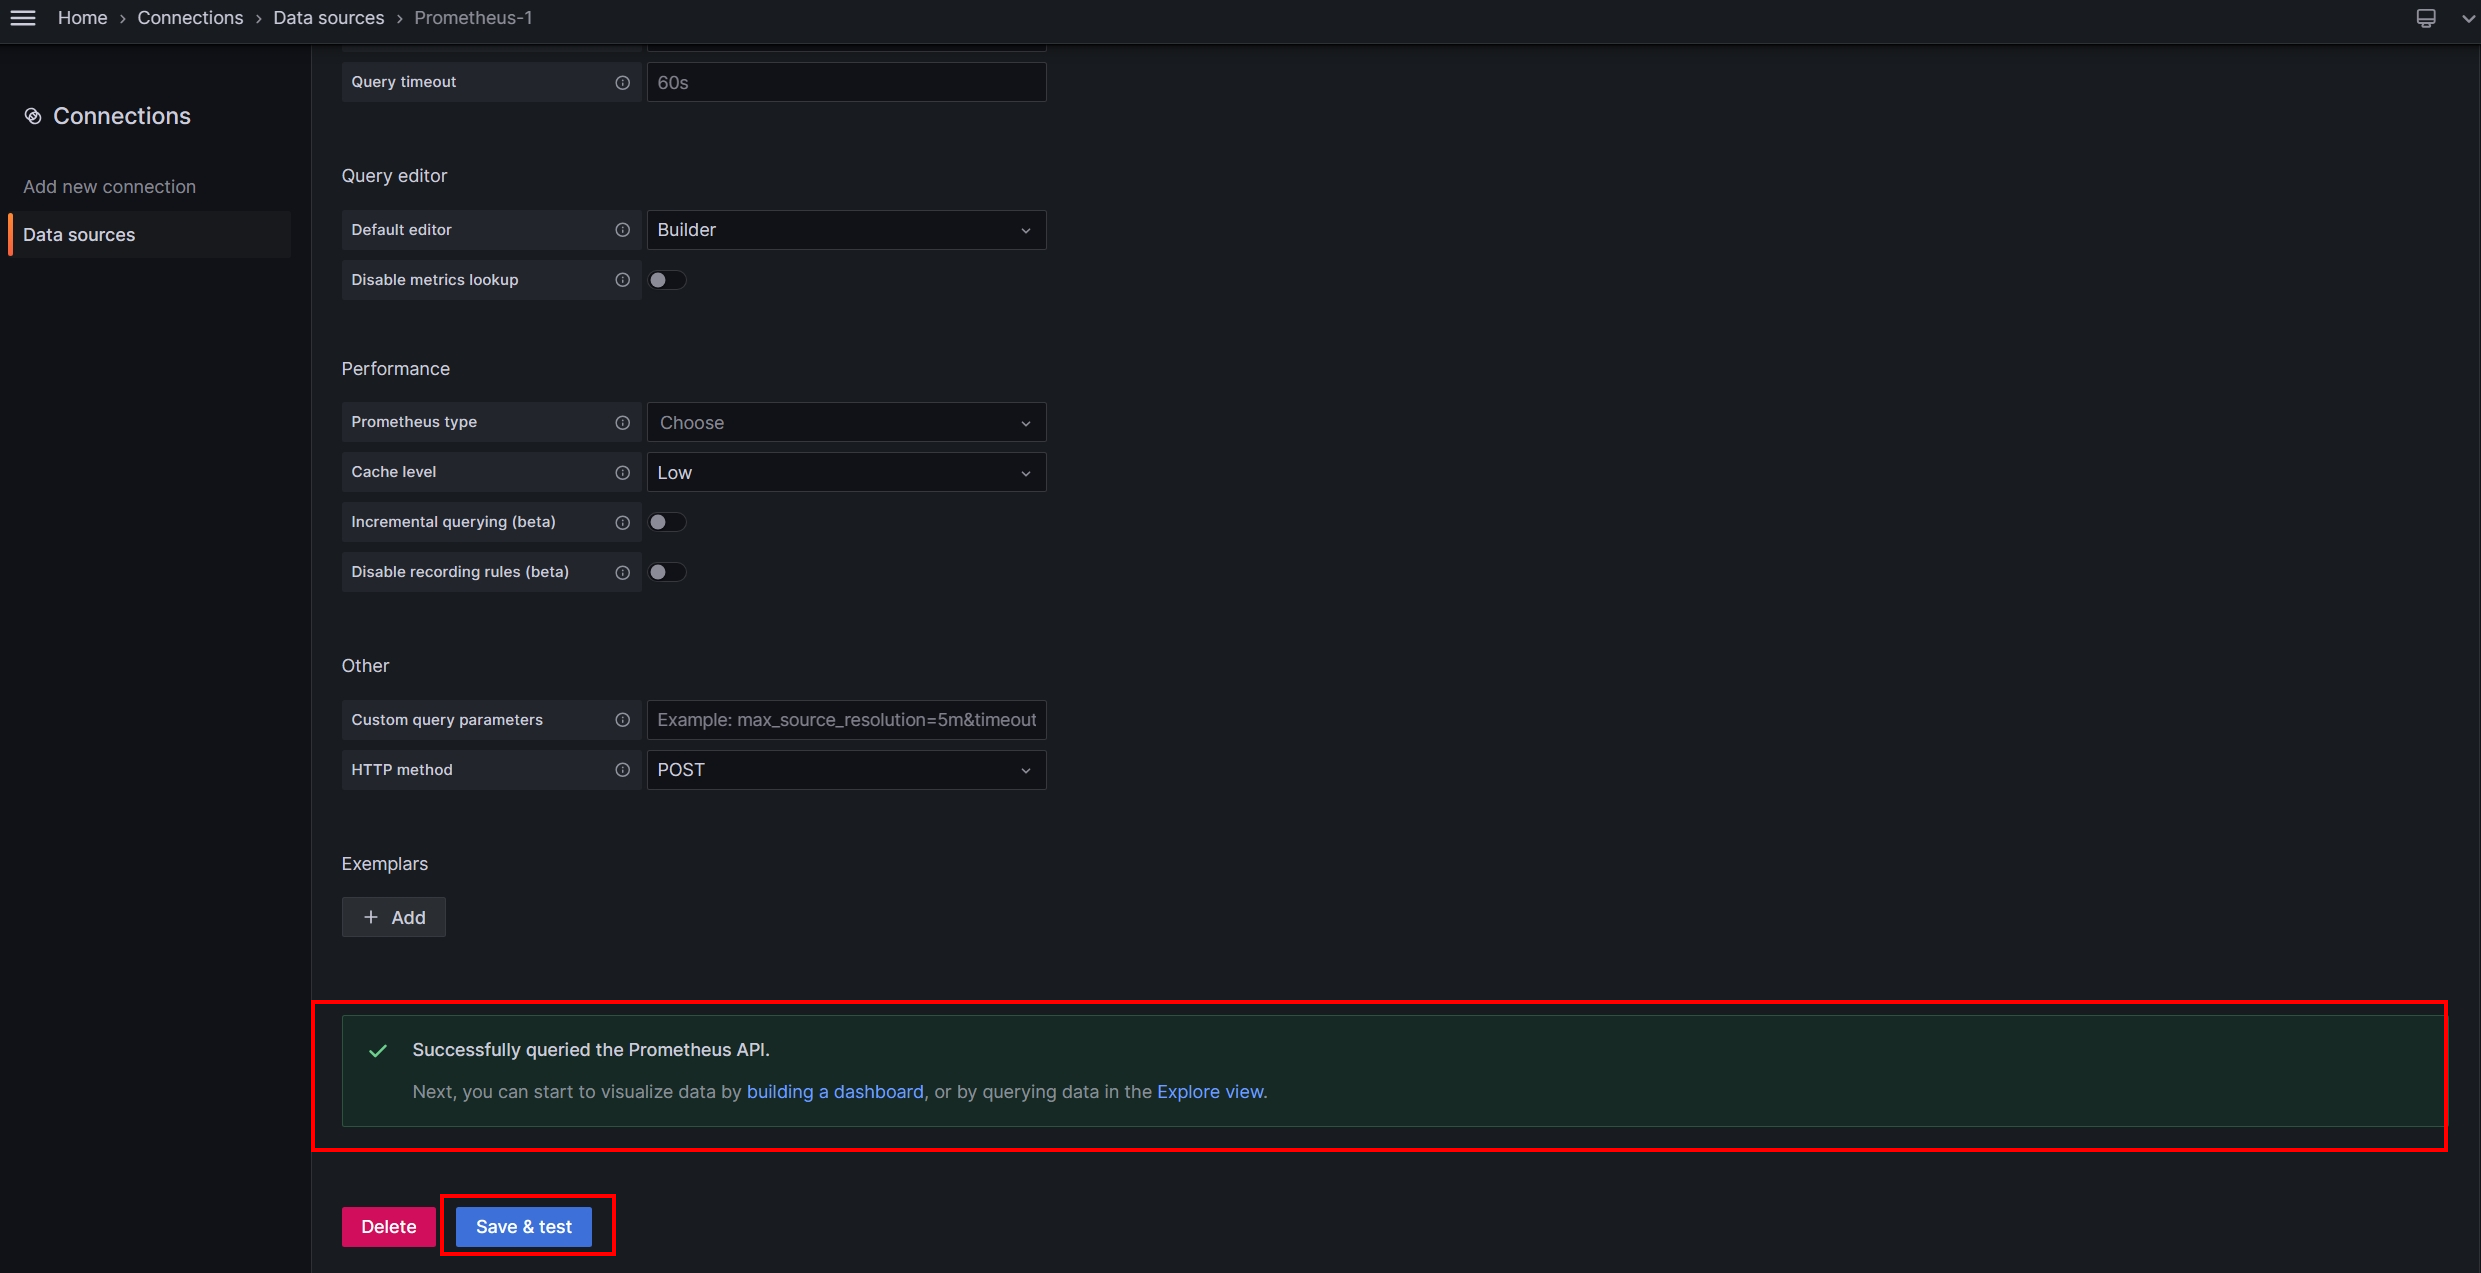
Keep other defaults. Click Save&test and a green prompt indicates that the source connection is successful.
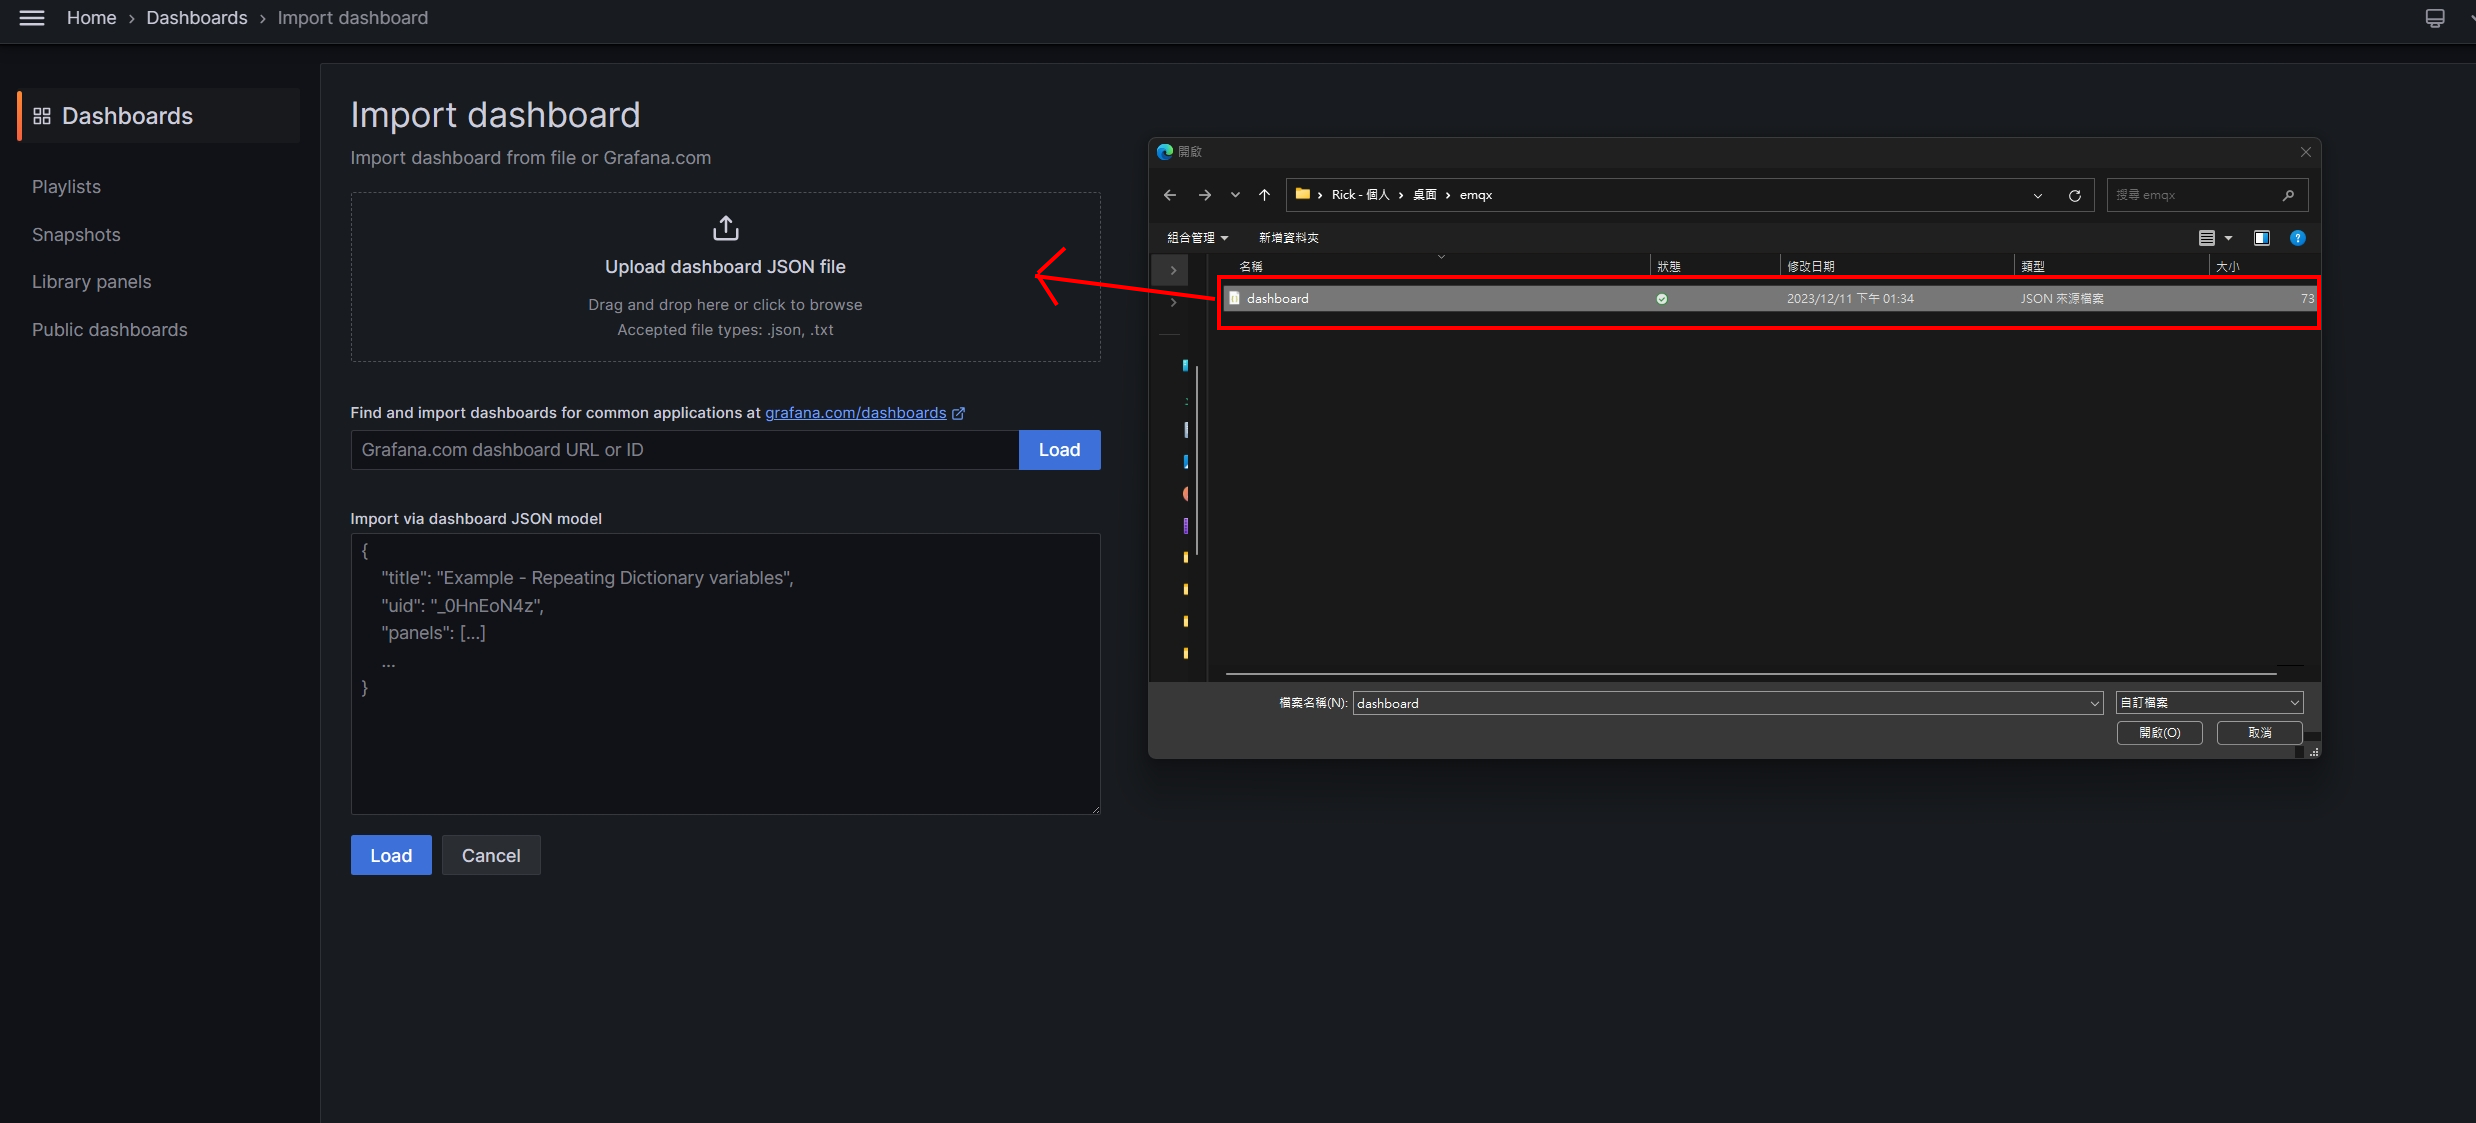
Import template
Follow the path below to click on the import dashboard interface Home > Dashboards >New > Import dashboard
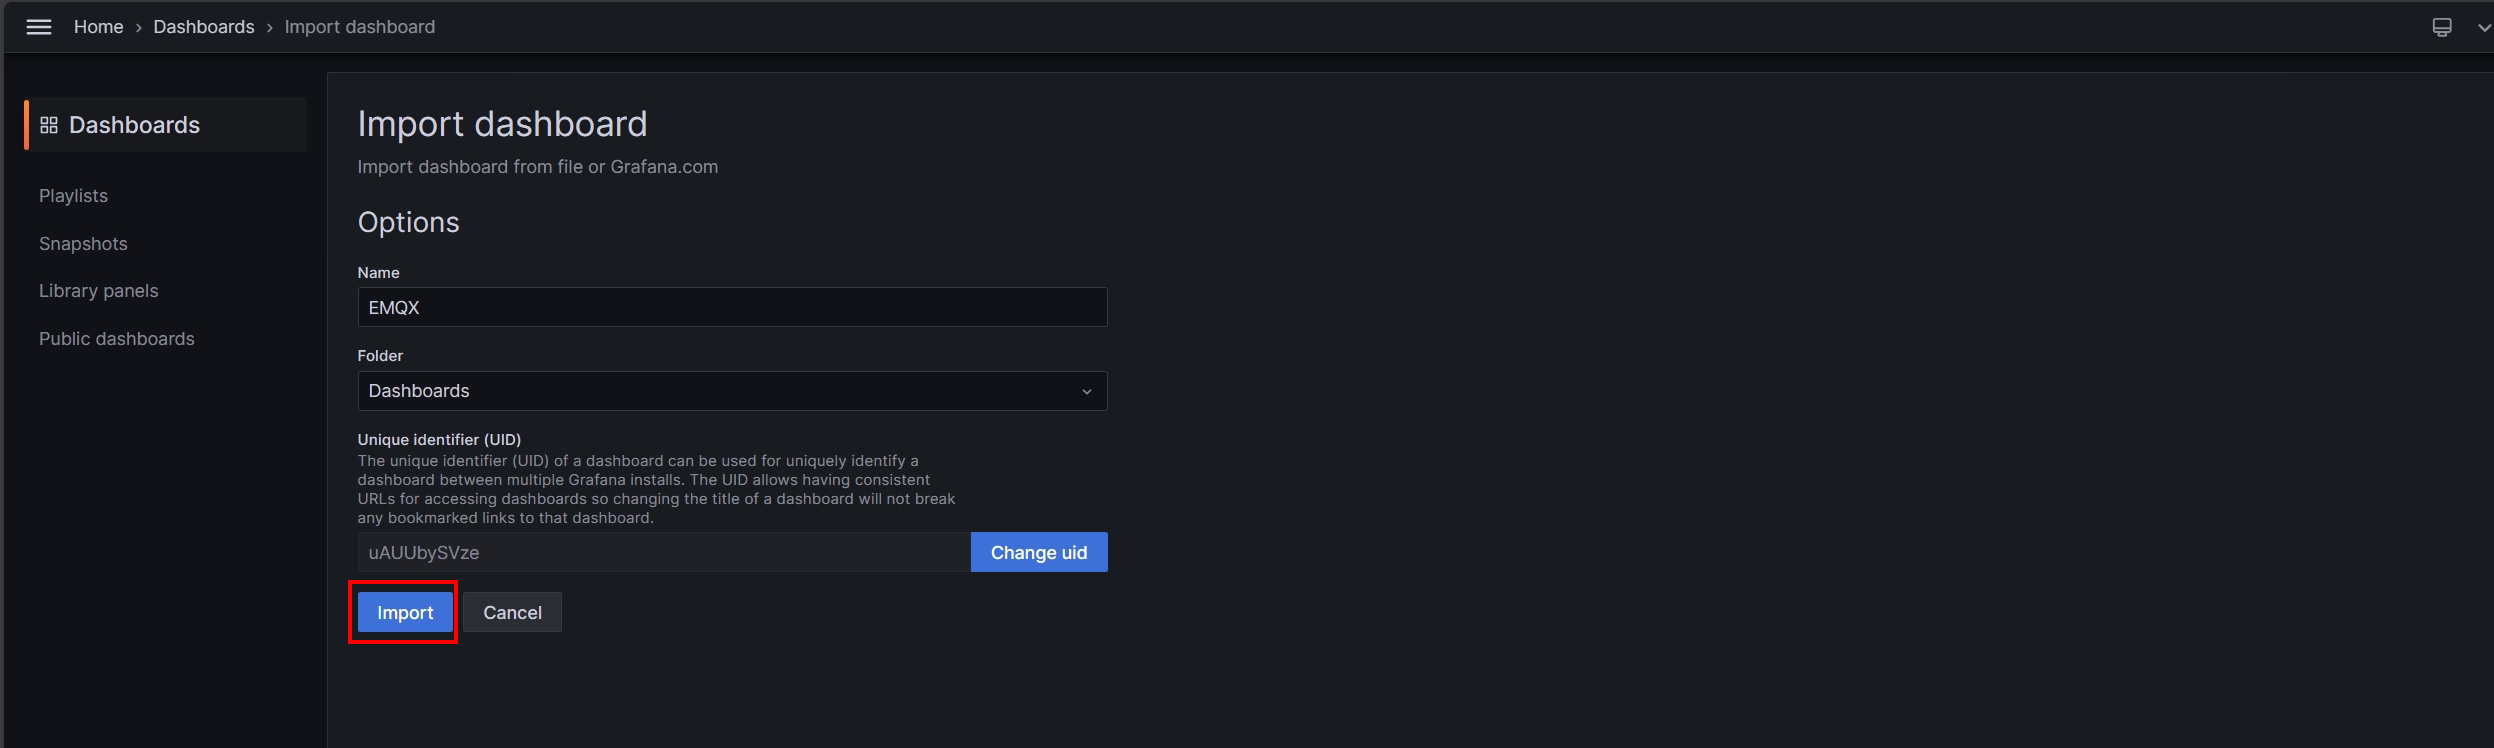
After confirming the name and Grafana path, click import
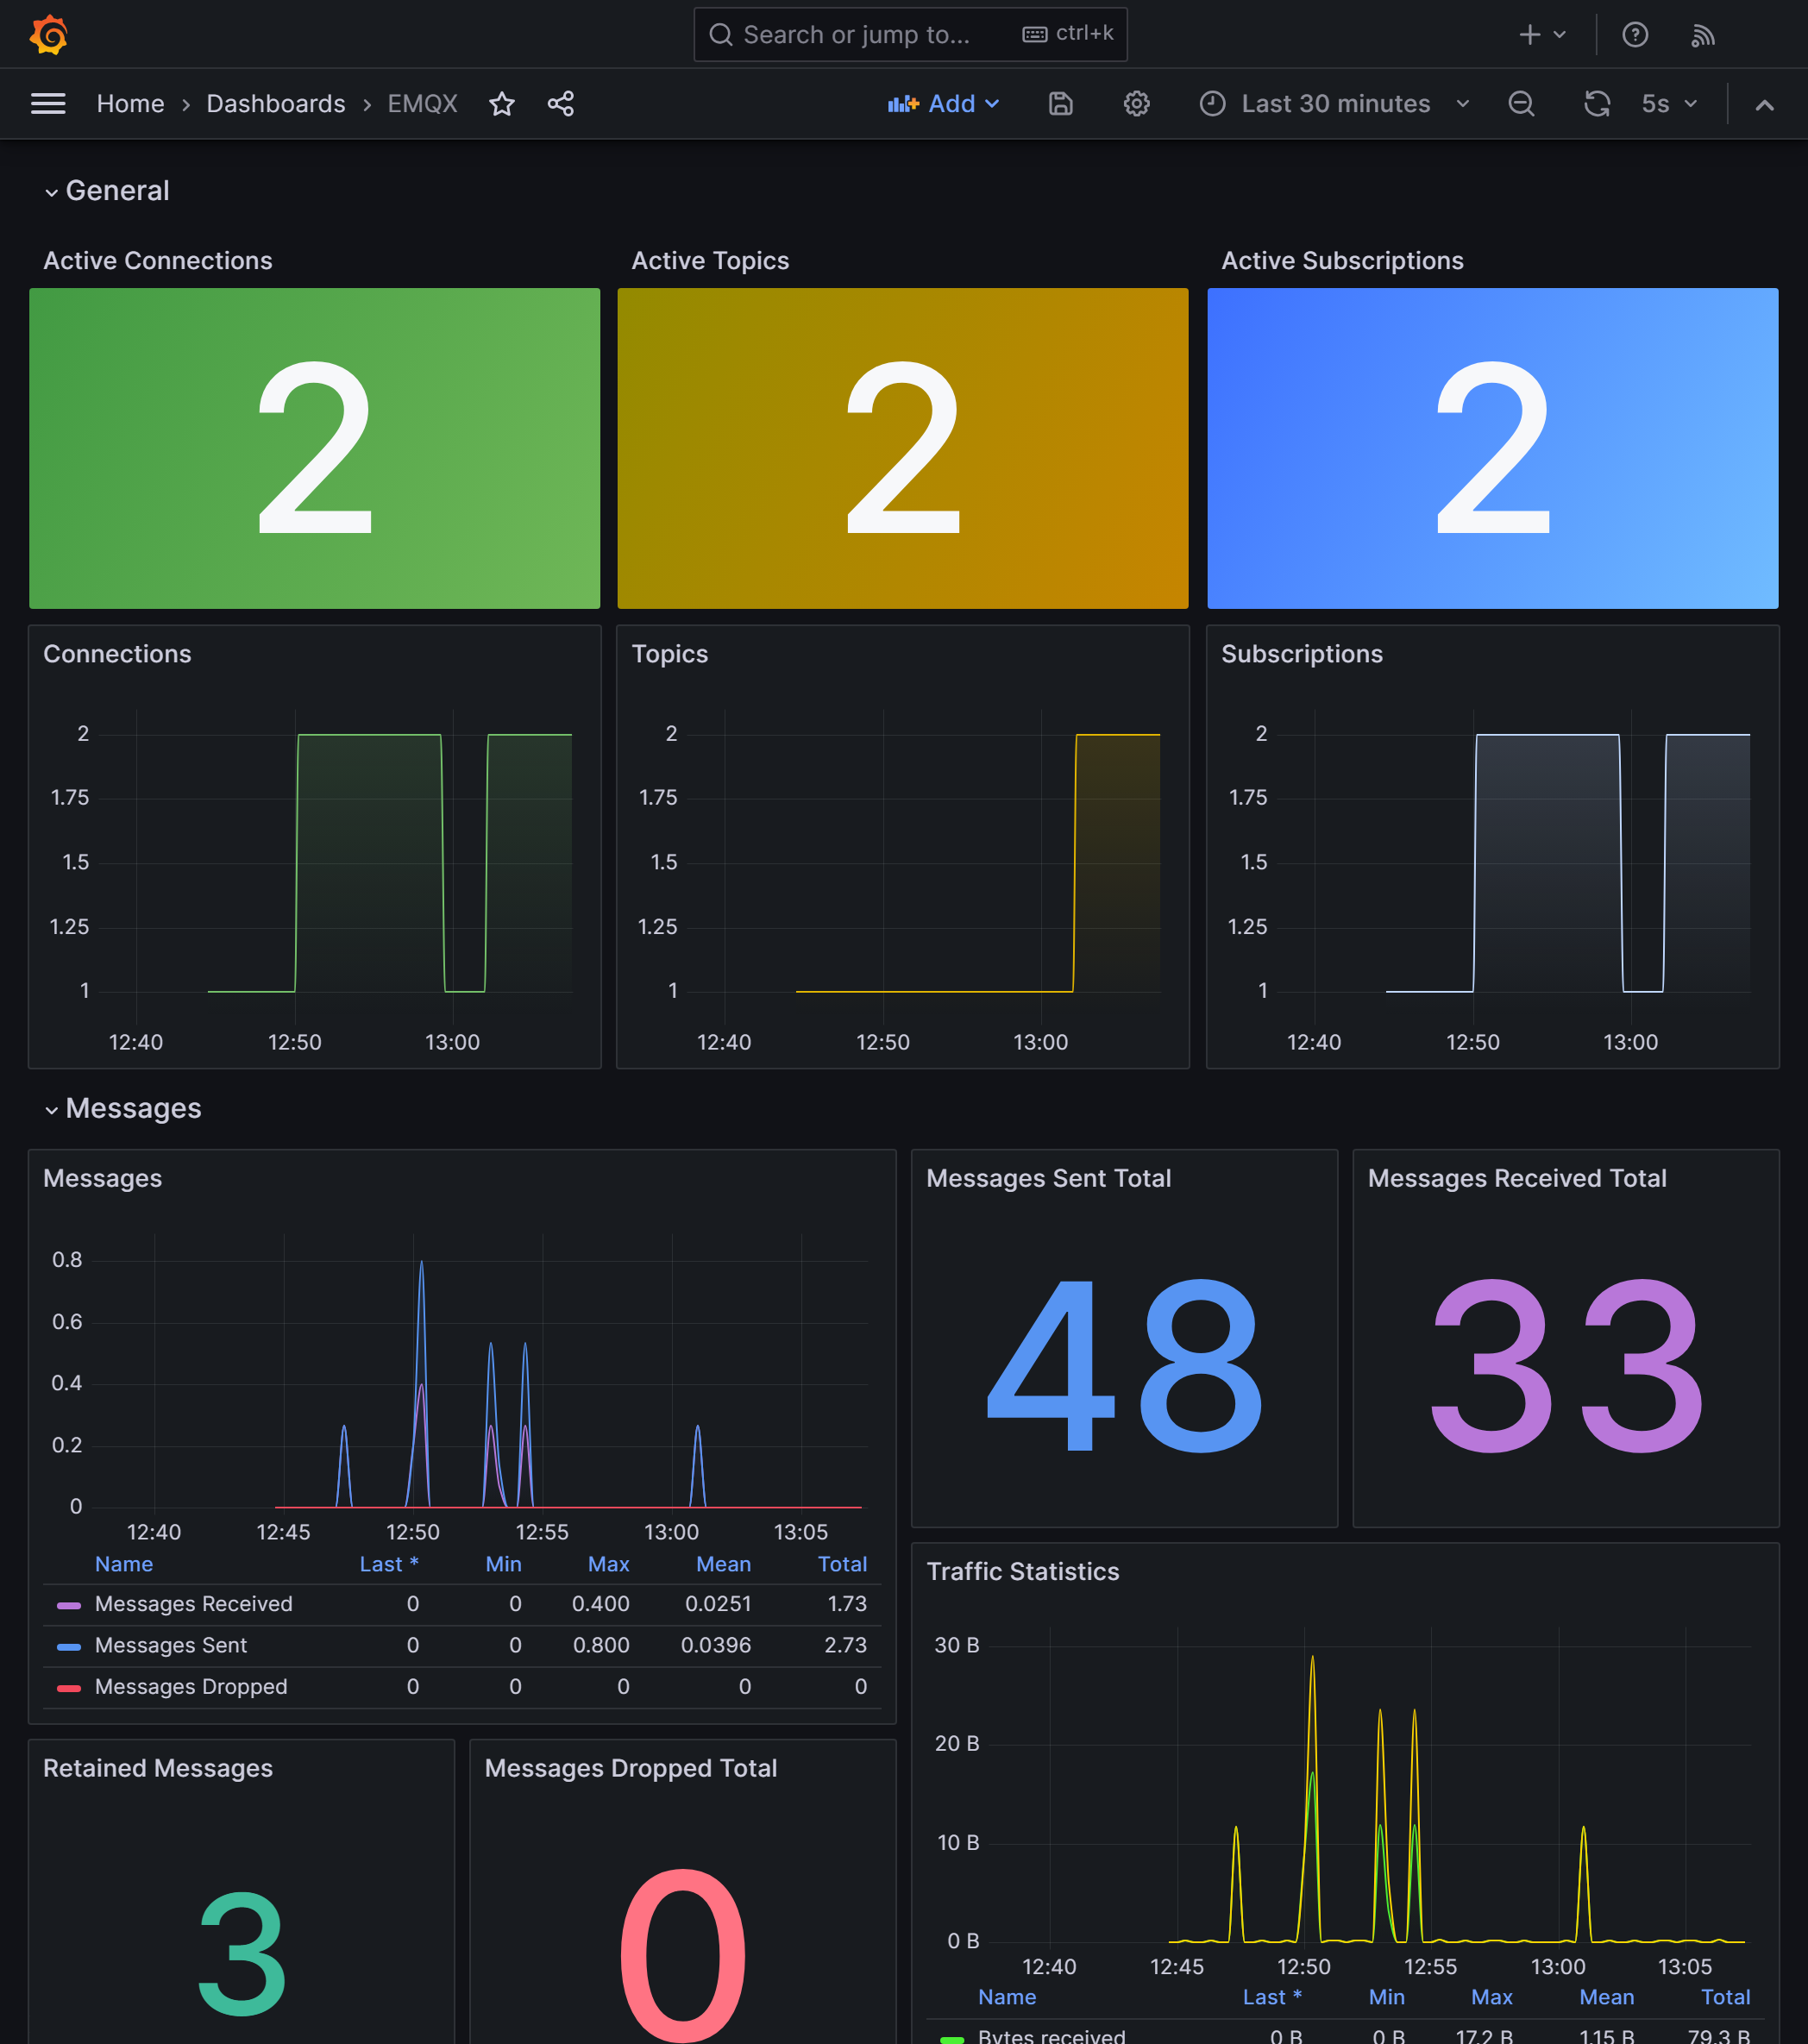
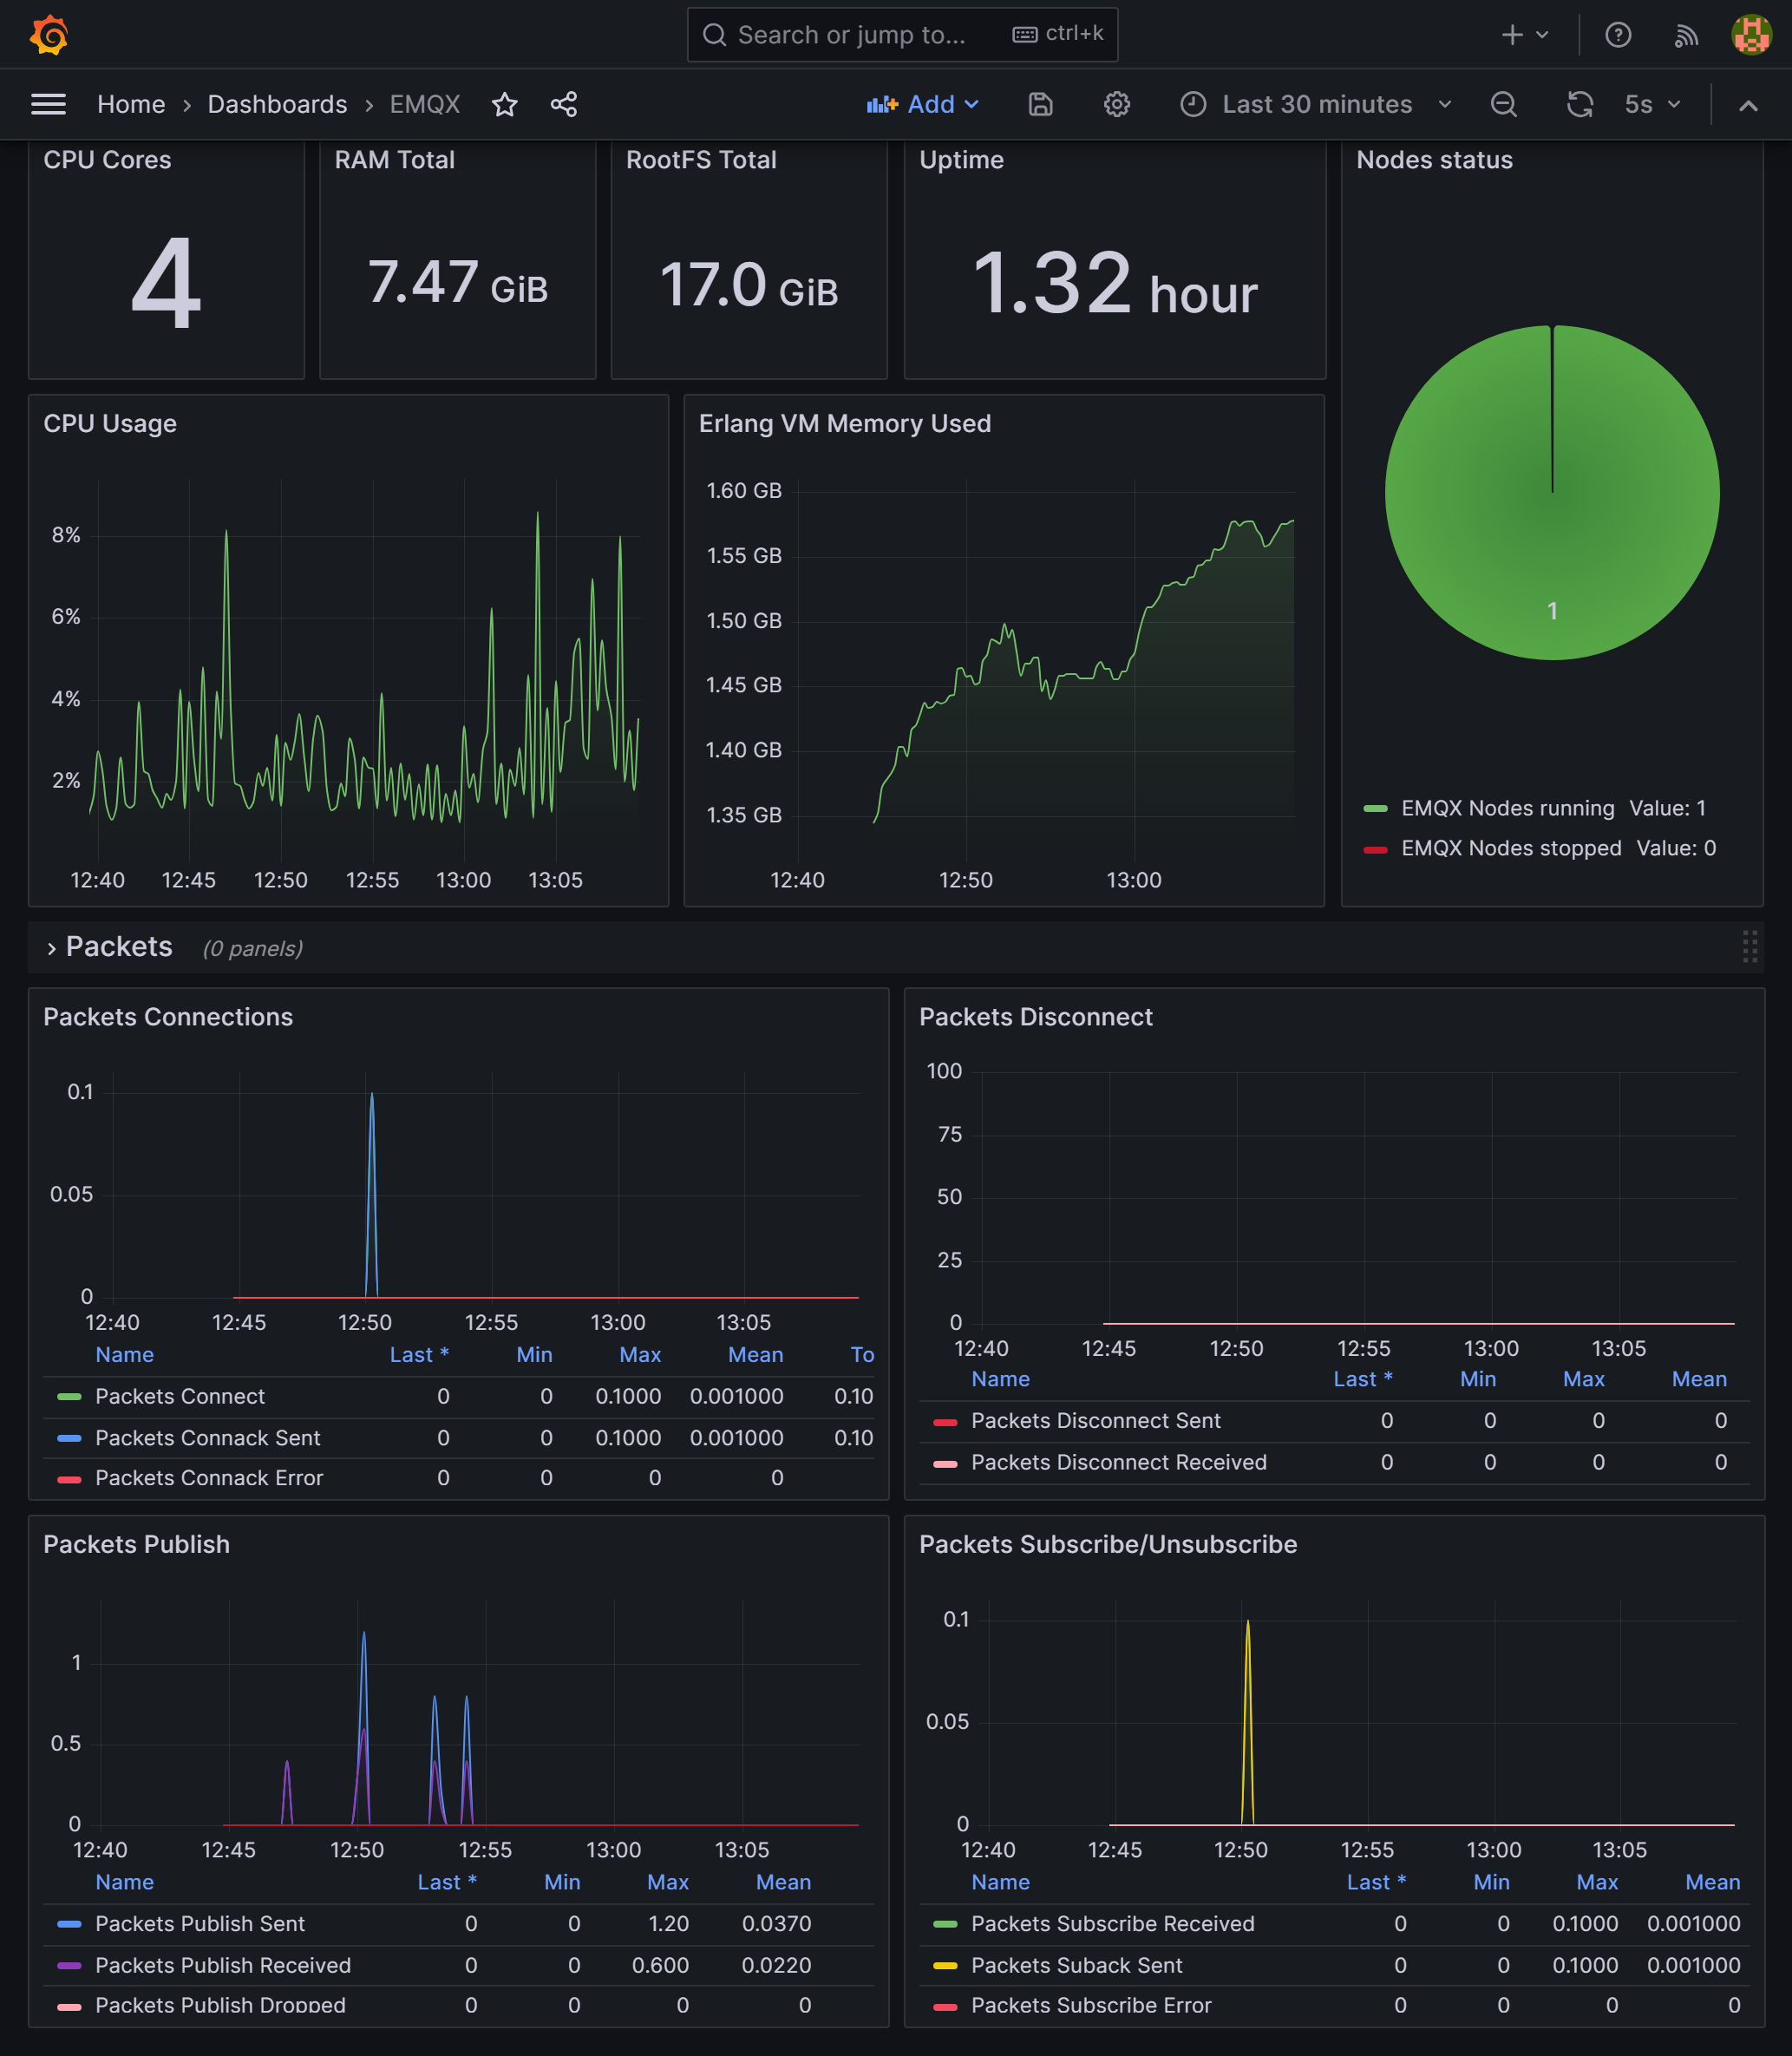
Final result
After importing the template successfully, you will see a dashboard similar to the one below
Conclusion
Although it is a quick deployment, some basic knowledge is required to prepare docker-compose.yaml in the early stage to fully package the container. In this part, the author also tried and made mistakes while packaging. But on the contrary, such an architecture needs to be reproduced in other environments in the future. It can be restored easily. Save time in the future
In addition, this article focuses on setting up a monitoring system, but Grafana can also issue warnings when specific values are abnormal. I’ll leave the relevant settings for you to explore~~ Class is over!!